Nurture your human skills with personalized learning programs
Achieve your organization’s ambitions through strategic learning. CrossKnowledge develops leadership and human skills, driving measurable business and organizational growth.
With personalized programs and a focus on improving human capabilities, we enable you to achieve your company’s goals and unlock tangible business impact.
The Learning
Impact Program
Develop the skills, mindset and frameworks to connect learning to business and performance outcomes.
A premium learning experience for HR, L&D, and OD professionals who want to lead capability development, influence stakeholders, and connect learning to measurable business outcomes.
The Learning Impact Program is brought to you by the Learning Impact Alliance, a trusted community of learning, HR, and organizational development leaders shaping how capability drives measurable business impact.
CrossKnowledge Learning Impact and Key Metrics
3.6 M
Learners
registered on our platforms in 2024
95%
activity rate
on our solutions
54
NPS
(20 market avg)
Internal monitoring dashboards – 2024
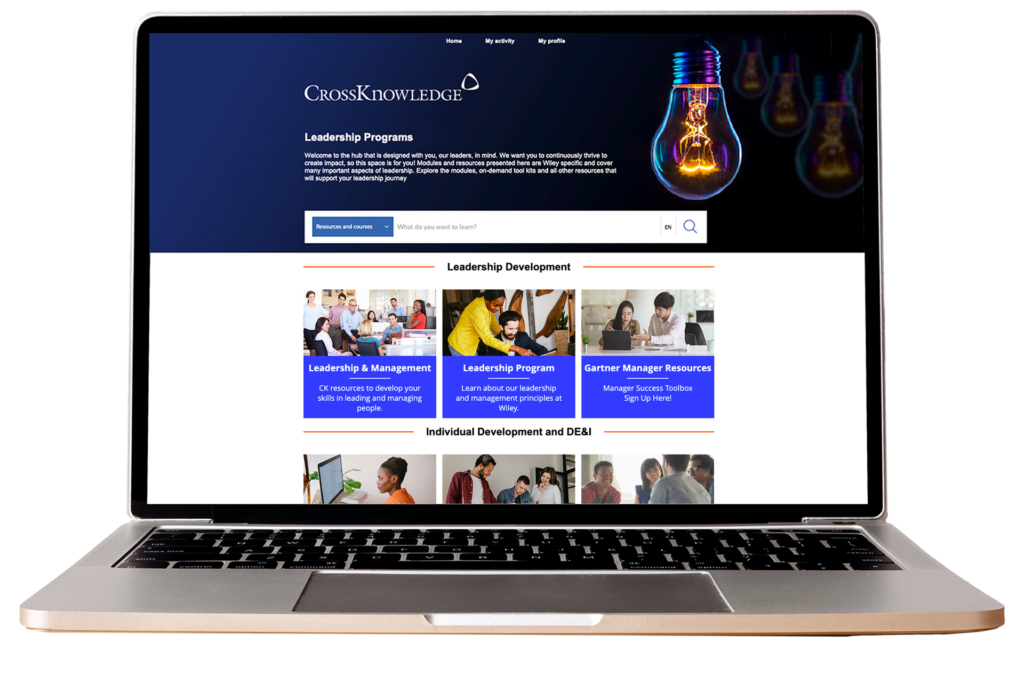
Transform your training impact through Learner Marketing
Boost learning engagement and outcomes by treating employees as valued customers
Creating an engaging learning environment directly impacts learner engagement, knowledge retention, and training effectiveness – ensuring users actively participate and achieve objectives through personalized, relevant content tailored to diverse needs.
What if your training programs had the same impact as your best marketing strategy? Success starts with deep audience insights. Understanding employees’ needs and learning styles allows you to design targeted programs that truly resonate and drive participation.
A proactive learner marketing approach boosts both individual performance and organizational resilience. The learner experience encompasses emotional and cognitive dimensions that shape engagement and retention.
By prioritizing human-centric learning, organizations foster continuous growth through multichannel engagement, gamification, and social learning – meeting every learner where they are, in their own language.

Understanding Programmatic Learning
With our 25+ years of experience,
we deliver a continuous and action-focused approach for skills acquisition
Capitalize on Blended Learning, a combination of self-paced and group learning
Focus on creating
one engaging journey
_
_
_
Personalize your experience to the needs of the learners and the business
_
_
Measure your KPIs linked to business outcomes to easily engage your stakeholders and share your successes
Design. Deploy. Engage.
Stay one step ahead: we’ll help you design, create, market and track,
and improve your learning programs with our learning services.
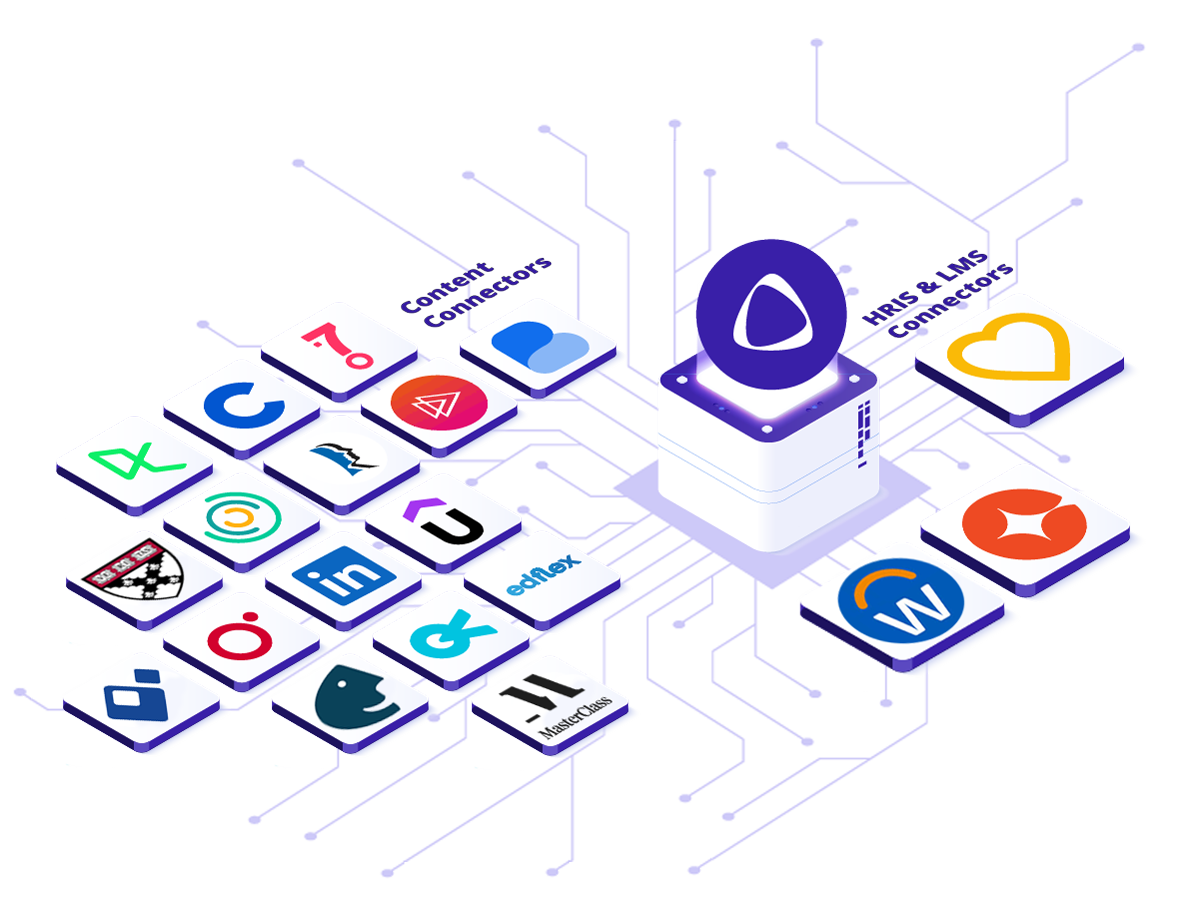
Integration, APIs, and Connectors
Ensure a seamless experience for your learners
Facilitation
to encourage practice in a safe environment
free space in your mind and agenda
for what really matters,
and achieve the full potential
of your learning experience
Go even further
and improve your own skills
Empowerment

Flexible learning formats to engage your employees
From custom academies to ready-made learning programs, find the format you need for proven learning.
Facilitated Upskilling Programs
Ready-to-deploy contextualized programs with social blended learning
Use the power of cohort-based learning and expert facilitators to deploy targeted, business-critical learning.

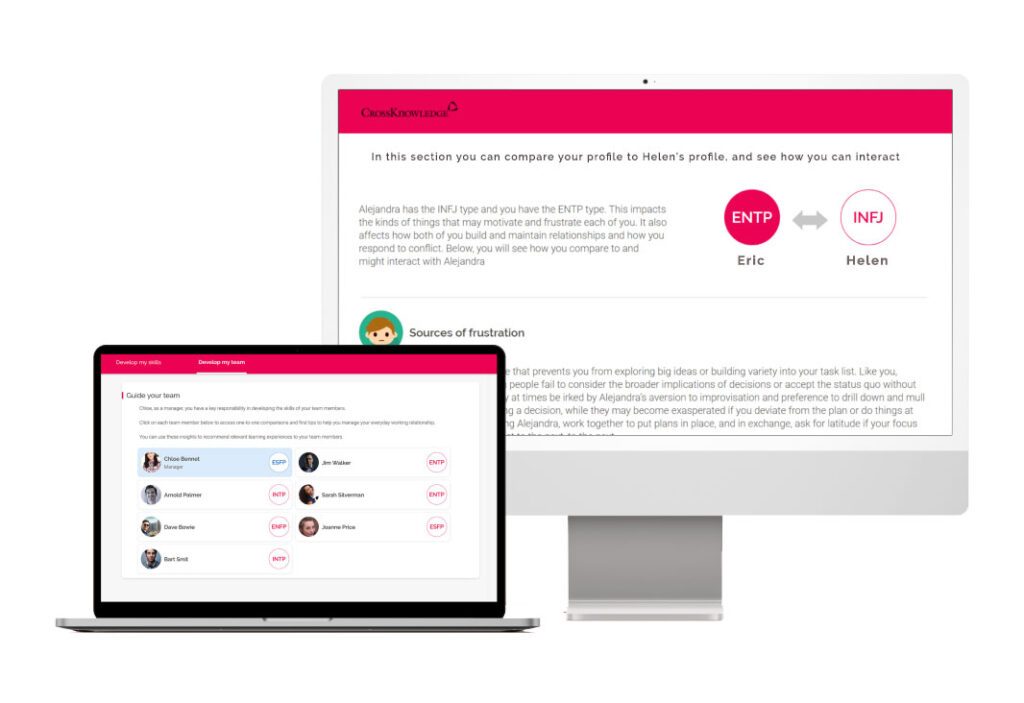
CK Connect
Personalized learning experiences so your employees reach their potential
Support the capacity of your managers to understand the dynamics of their team and promote healthy cooperation.
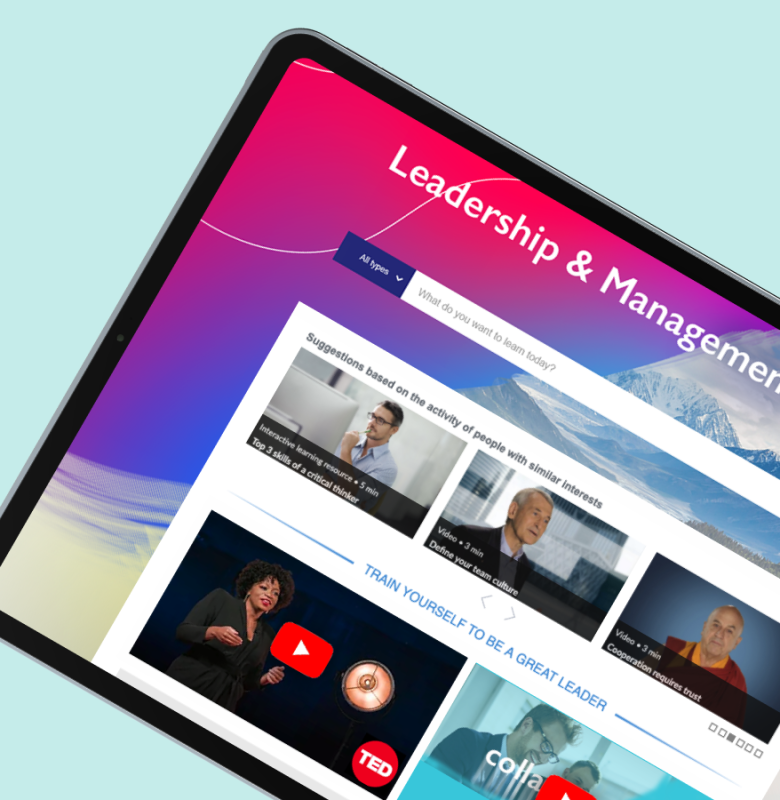
Skill Paths
Meet today’s talent development needs with short learning pathways
Deliver executive training, learn from global thought leaders, and embed new learning quickly in short formats, for improved knowledge sharing and retention.

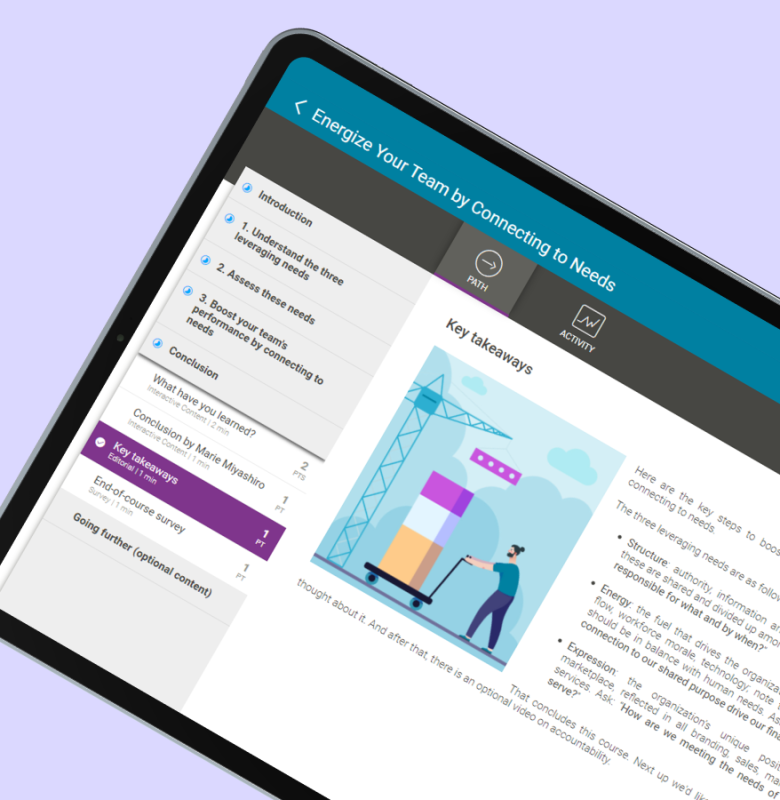
Path to PerformanceTM
Discover a ready-made collection of carefully designed guided programs for the effective acquisition of a full skillset.
Give your learners a complete understanding of a wide variety of skillsets with content from global thought-leaders and powerful storytelling, all customizable to your specific business context.


Create business impact with blended learning experiences
Find all the support you need to achieve your business and learning outcomes by reconciling employees’ and corporate challenges with ready-to-go solutions and bespoke programs.
Expertise building

Capability academies
Whether it’s a Leadership or Supply Chain Academy, offer targeted groups a strong learning community where they can develop specific skills and share knowledge and best practices.
Self-paced Blended Learning
Capabl Build, the blended learning paths
With Capabl Build, create engaging blended learning paths, and deliver a modern, accessible, and engaging learning experience. Include all your content and native learning activities in a user-centric interface. Capabl Build proposes a clean, intuitive and visually appealing experience.
Anywhere, Anytime Learning
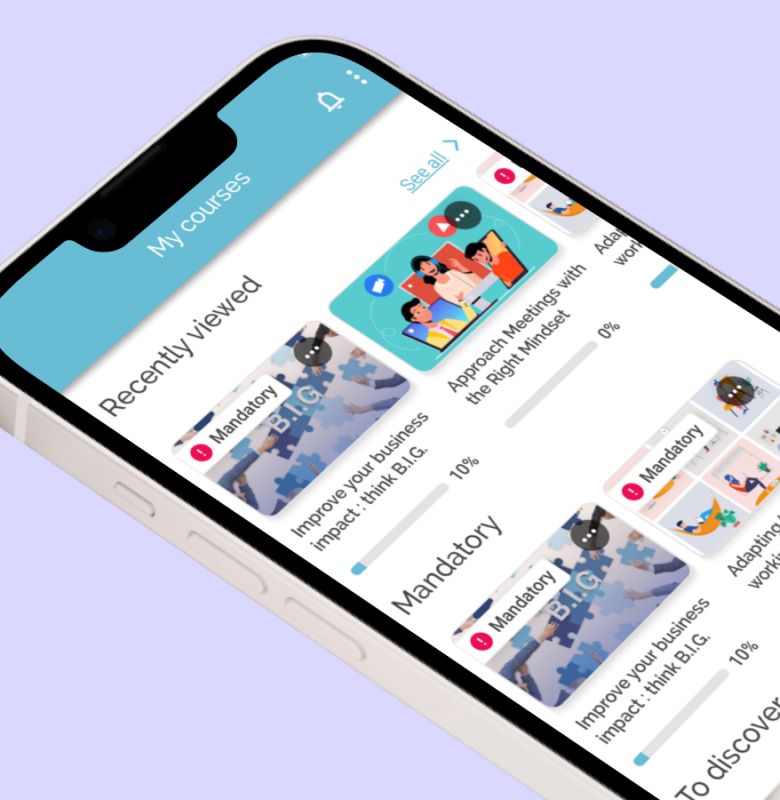
Mobile Learning
Equip your employees to develop their skills wherever they are, anytime. With MyLearning App, offer one experience regardless of the device.
Reports and dashboards
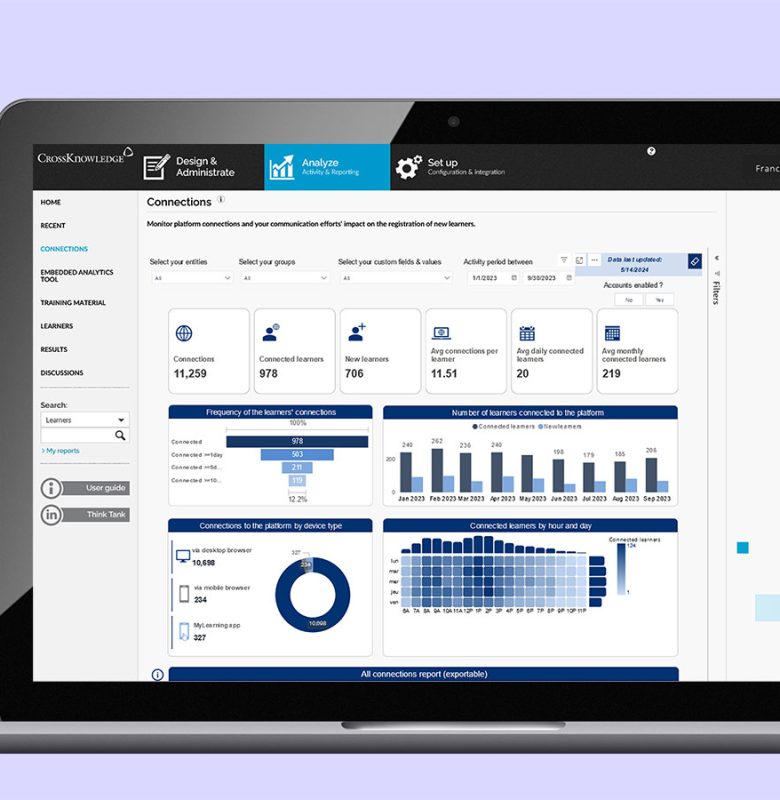
Learning Analytics and Reporting
Prove the power of learning with compelling visualizations and in-depth reports
Ecovadis Sustainability Rating
As part of our commitment to society, our people and the environment, Crossknowledge completes a thorough assessment of its business sustainability practices every year through EcoVadis, a global leader in business sustainability assessments.
The EcoVadis assessment includes 21 sustainability criteria across four core themes: Environment, Labor & Human Rights, Ethics and Sustainable Procurement.
In our latest rating, which was completed on September 2025, we earned a Committed badge, which demonstrates our progress toward sustainability.
Our latest client testimonials


Reseller Partners Network
Interested in partnering with CrossKnowledge? Want to make a real difference in the world of corporate learning?
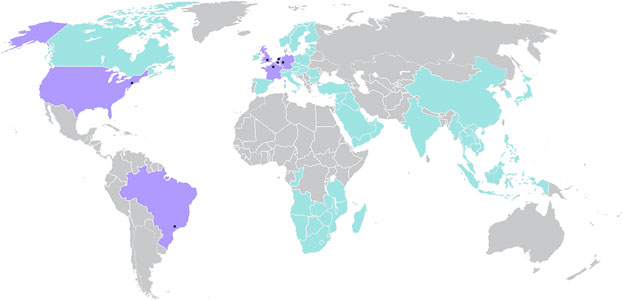
Join our growing international reseller partners network! Your expertise combined with our solutions will help customers achieve their training goals, while you become part of a worldwide network committed to quality and success – and we’ll be there to support you every step of the way!
Latest news

Unleash your courage at work with Gill Hasson

Artificial Intelligence & LLM
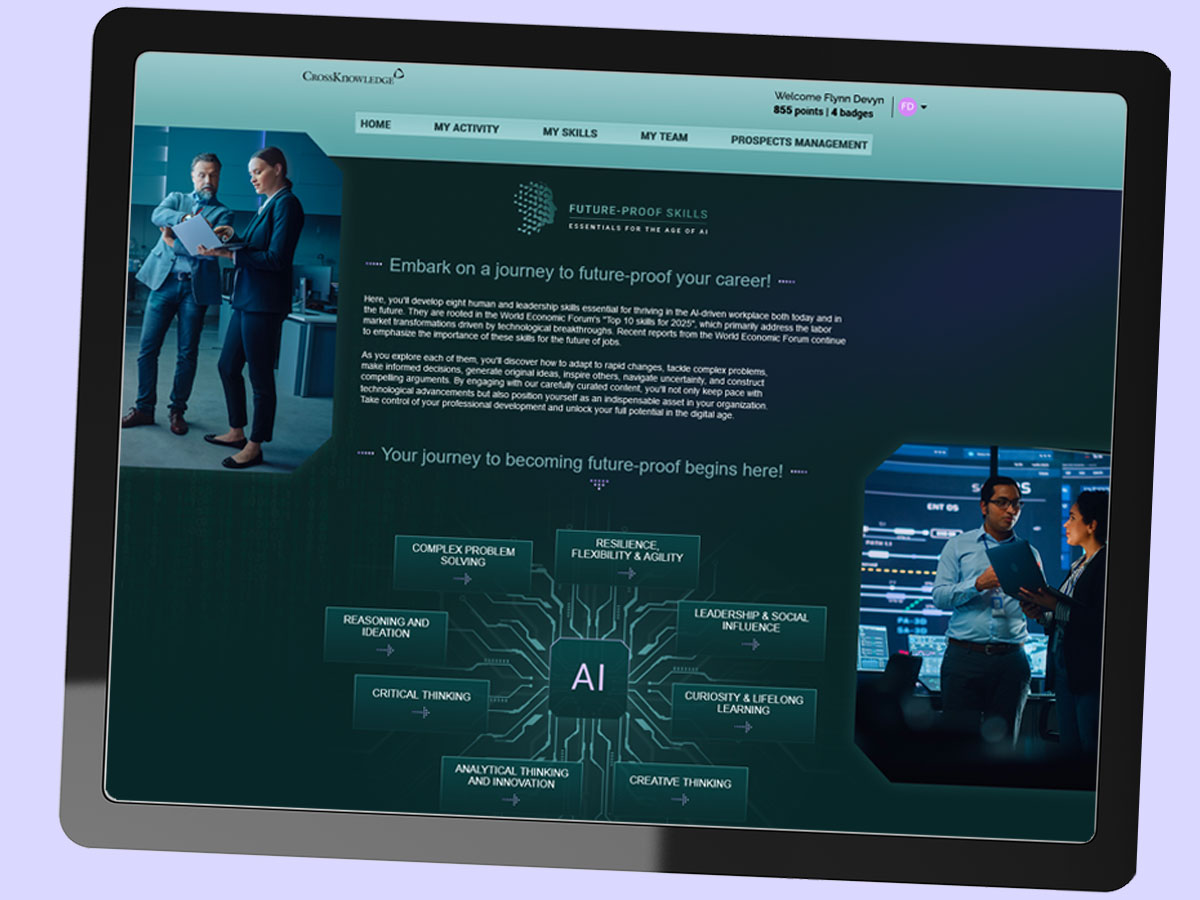
Developing essential skills for the AI era
On the front page

Essendi’s journey to a learning culture that drives business impact

You’ve invested in upskilling. So why isn’t performance improving?
Our podcasts